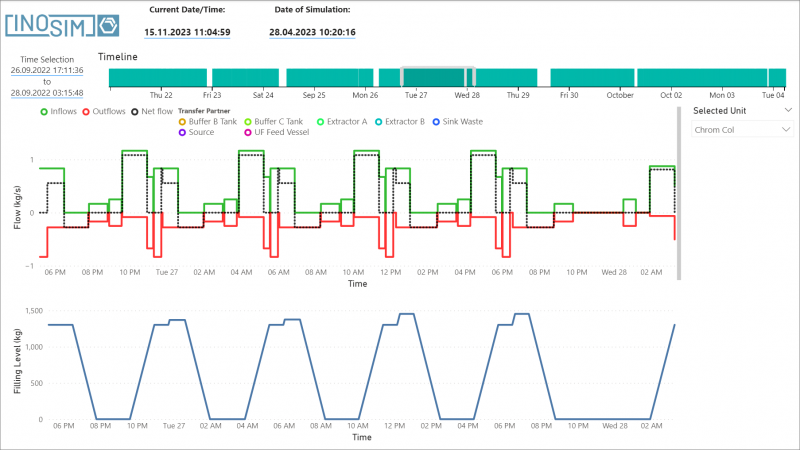
In this tip and trick, the Transfer Analysis dashboard is introduced. It is an extension of the Power BI standard dashboard that allows you to analyze the net mass flow of a unit in your simulation model and see the constituent flows.
Setup
Download the Transfer Analysis.pbit from the Downloads section. Simulate a model with the BICON Export enabled. The export of transfers as well as the filling levels must be enabled.
If you use the BICON Explorer version 1.2.1 or newer, perform the following steps:
- Place it in your BICON Base directory, in the folder _Workbook Templates.
- Then, in the BICON Explorer, click on the gearwheel and use it either as Standard or Empty Workbook.
- Now, select the export you want to analyze and view it with the Standard/Empty Workbook.
If you use an older version of BICON:
- Copy the path to the folder of your simulation results. Open the Transfer Analysis.pbit and paste the path to the field Source Path.
Please note that more preprocessing is required for the Transfer Analysis compared to the standard workbook, so load times may be increased.

Usage
When first opened, the dashboard Transfer Analysis will appear empty. Select a unit from the Selected Unit dropdown on the right side to start the analysis.
With a unit selected, the dashboard will show two graphs:
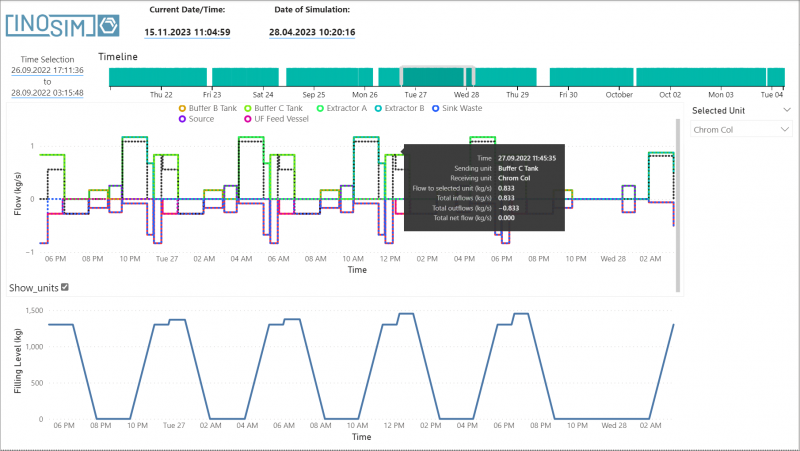
- The upper graph displays the inflows (green) and outflows (red) of the unit over time. The black dotted line shows the net flow. By scrolling down in the diagram, the checkbox Show_units can be activated. This separates the in- and outflows by transfer partner, showing a separate dotted line for each one. Only continuous in- and outflows are shown. Please note that due to performance reasons, when values change, tooltips are only shown at the level the value changed to.
- The lower graph displays a filling level diagram.

More Questions?
Want to know more about this topic or have another question? Please contact us!
More Tips & Tricks
Custom Failure Handling
In INOSIM simulations, custom stochastic unit failures can be utilized to accurately replicate reality in a plant. With the Statistical Analysis Add-on, a large number…
Custom Probability Distributions
Learn how to use the implemented probability distributions in INOSIM to add stochastic failures or process parameters to your model, and how to set up…
Applying Table Objects
Table objects in INOSIM are indexed tables. By the row or column headline, you can directly access a cell’s content without having to search for…


