INOSIM Expert Edition
Design, Analysis, and Optimization
INOSIM Expert Edition combines the features from our Plant and Process Editions to create a do-it-all solution. Whether you are developing and designing a new robust process or making improvements to an already existing process, the Expert Edition can be your guide to making more informed decisions and achieving a cost-effective, sustainable, undisturbed, and profitable production.
- React to changes in production requirements (e.g., altered product mix, capacity extensions).
- Analyze a production’s resource and energy efficiency to improve sustainability.
- Generate mass and energy balances (e.g., for scaling up laboratory processes)
- Simulate unexpected events (e.g., failures, staff drop out, fluctuations in supply and delivery)
Building a Virtual Plant
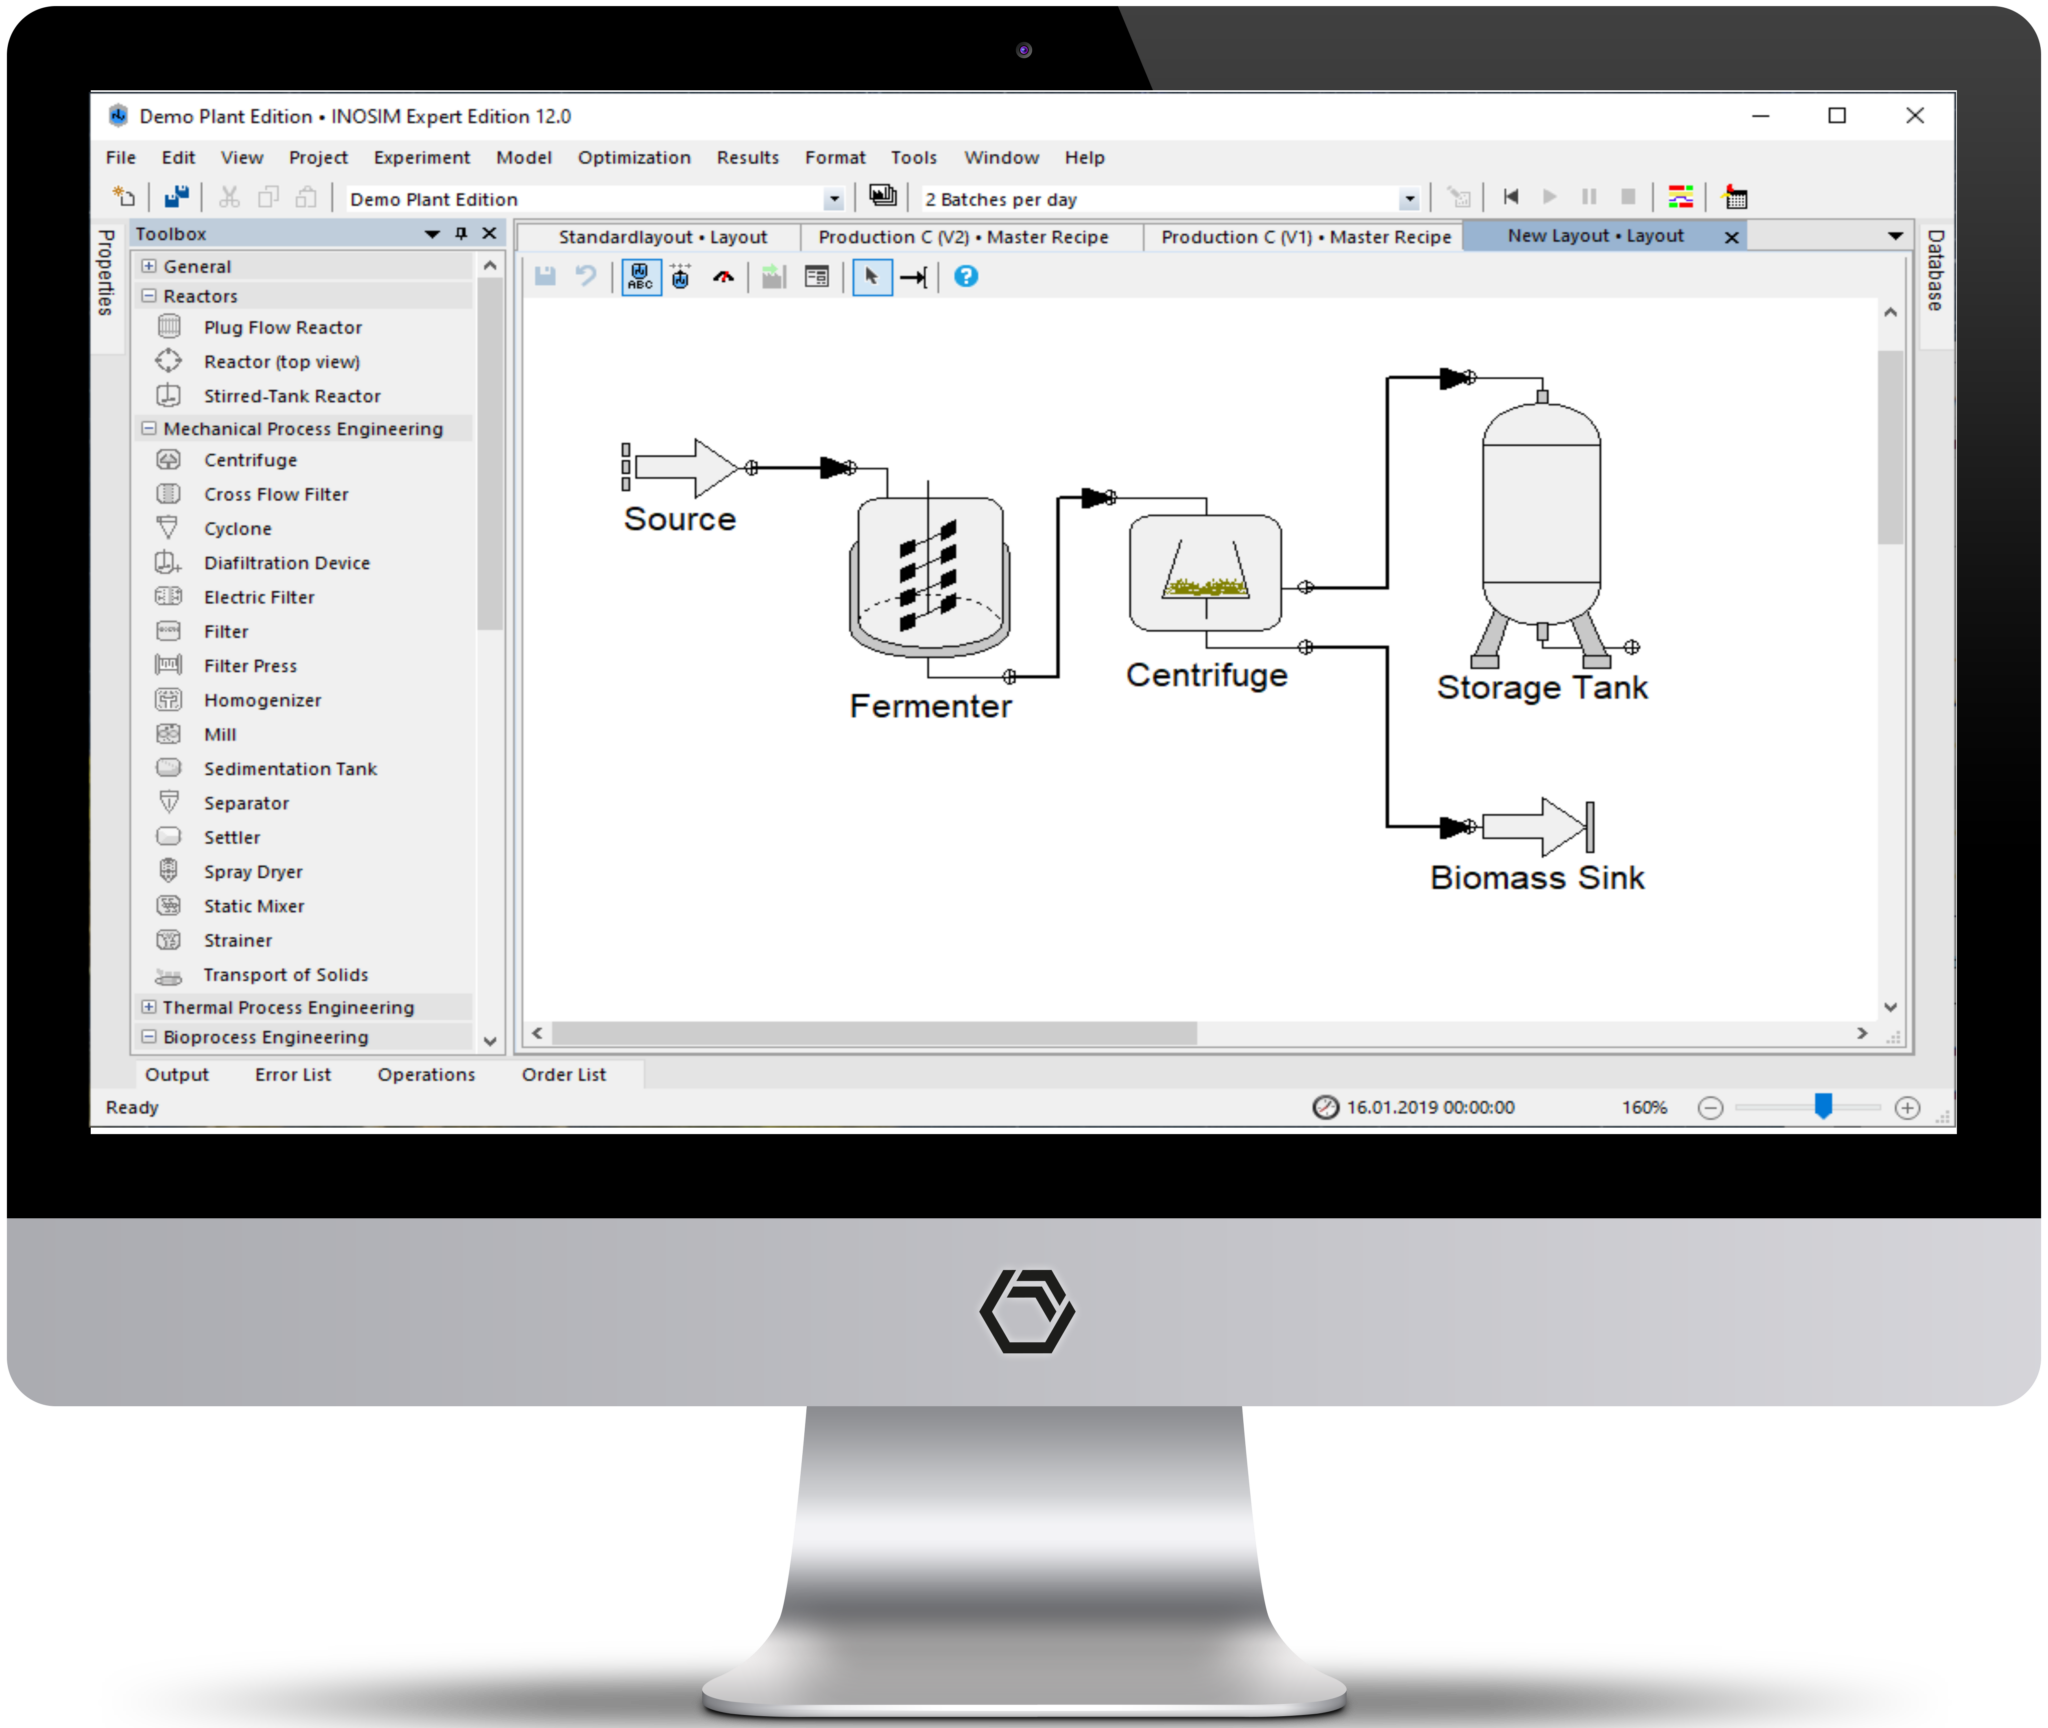
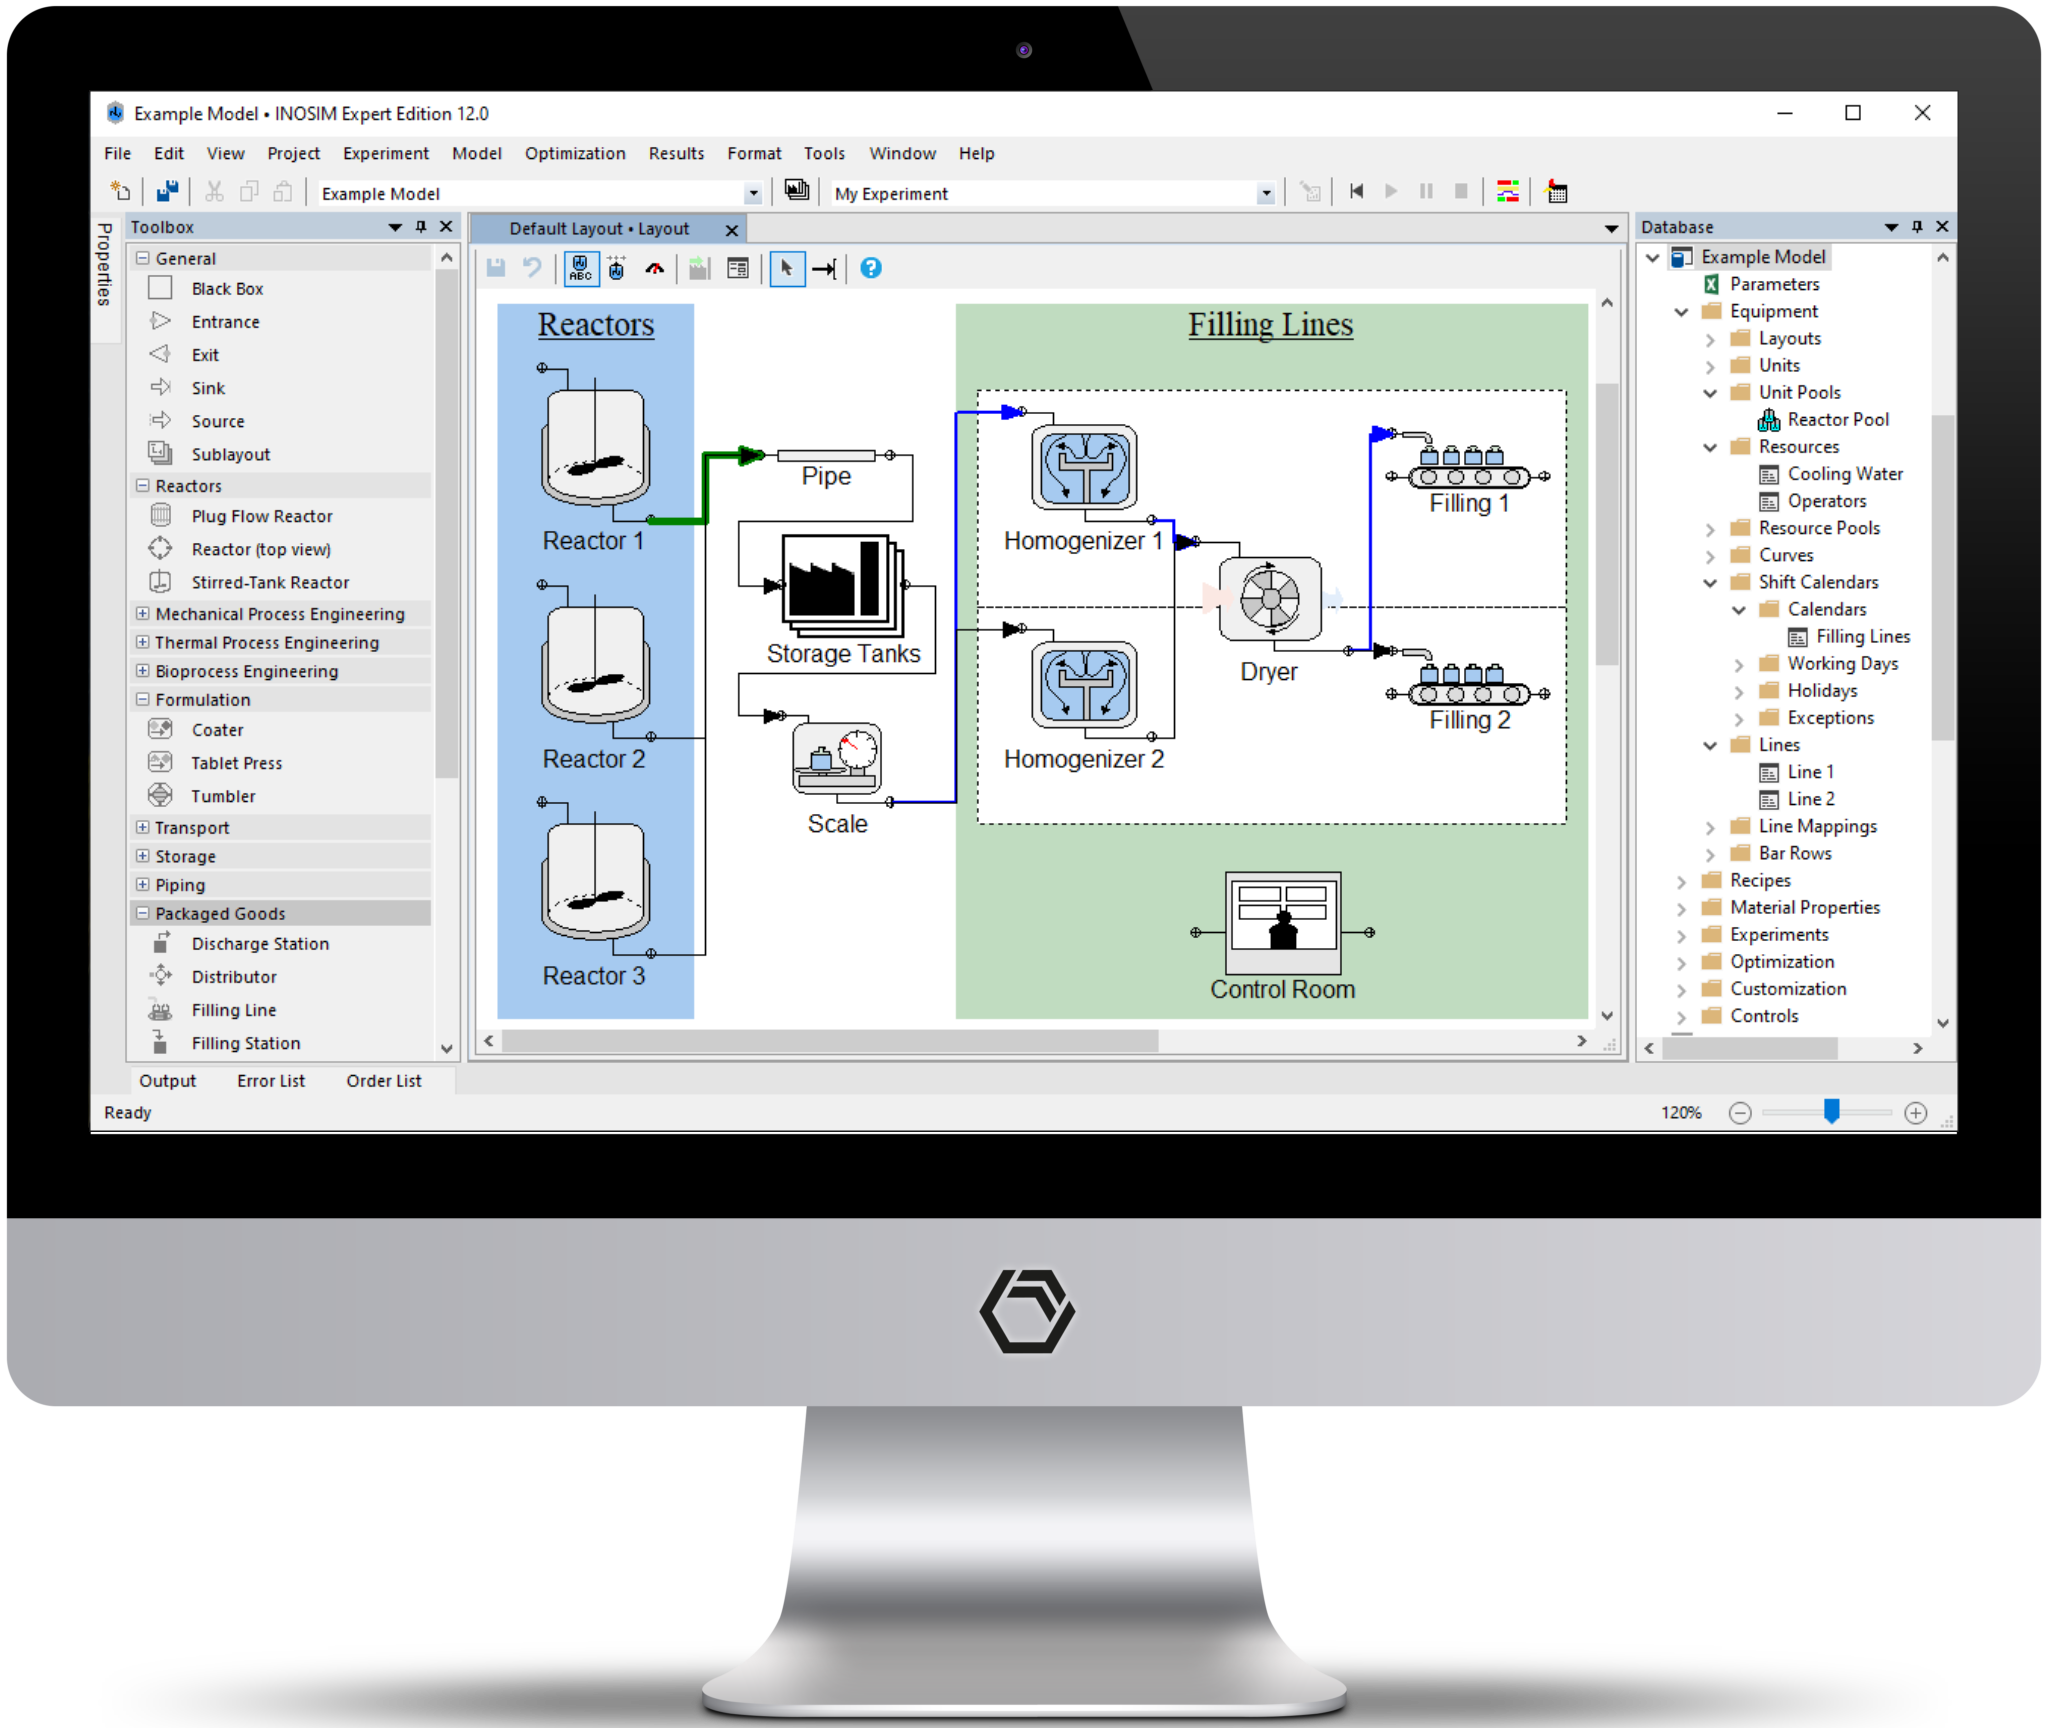
- Plant layouts are visualized via flowsheets and can include raw material sources, process equipment, pipes, storage tanks, waste sinks, and more.
- Flexibly define production workflow for batch, continuous or mixed processes in recipes, which describe the operations to be carried out on specific equipment.
- Define materials and resources such as cooling water, operators, or CIP skids.
- Orders determine which recipe is to be executed and at which time and in what order. They can be scheduled manually within the order list or dynamically via VBA for advanced control.
Supplemental Modeling Elements
- Use sub layouts to organize common equipment and neatly design even the most complex of plants.
- Define classes of similar units in pools. Then, INOSIM will dynamically select free units from the specified pool when called for.
- Lines and line mappings are used to define and model production lines. Furthermore, you may dynamically assign orders to be carried out on specific lines to optimize your production scheduling or evaluate the impact of rush orders.
- Pipes are connecting unit objects used to direct and measure material flow.
- Resources are auxiliaries for production and can range from operators to cooling water to quality control rooms.
- Further control the availability of equipment and resources with shift calendars by defining working days, holidays, and exceptions.
Flexible Recipe Elements
Recipes define the production workflow within equipment (i.e., list of processing operations, durations, transfer locations and amounts, etc.). INOSIM Expert Edition provides material flow operations as well as an extensive model library for common unit operations. Depending on the available data for the unit operation, select a simple black-box, shortcut, or detailed model (e.g., for adsorption: yield or isotherms). Each model provides:
- A predefined, yet customizable recipe structure.
- Mathematical models to describe mass and energy balances.
In case you need more, you can easily implement your own models as recipe modules using INOSIM’s built-in VBA scripting engine. Share them with your colleagues, to build a company-wide library of recipe modules.
The model library contains models for:
- Chemical and thermal drying
- Evaporation
- Liquid-liquid extraction
- Phase separation
- Fermentation
- Concentration adjustment
- Heating/cooling for batch, fed-batch, and continuous processes.
- Generic split that can be used for any separation process that can be described by split factors, yields, or mass fractions (i.e., centrifugation, filtration, distillation)

Get Insight into Downtime Effects
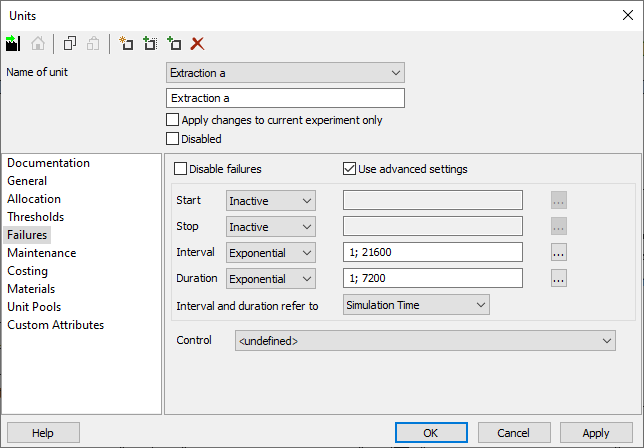
Evaluate the impact of planned and unplanned downtimes (maintenance and failures) on your production performance. With INOSIM Expert Edition, you may:
- Forecast failure events based on pre-defined or custom statistical distributions.
- Analyze the influence of equipment failures and maintenance strategies on the overall production process.
- Implement a database for the planning of maintenance.
- Link model parameters such as process times, production rates, or product demands with distributional functions to evaluate process variances.
Investigate the Impact of Process Fluctuations
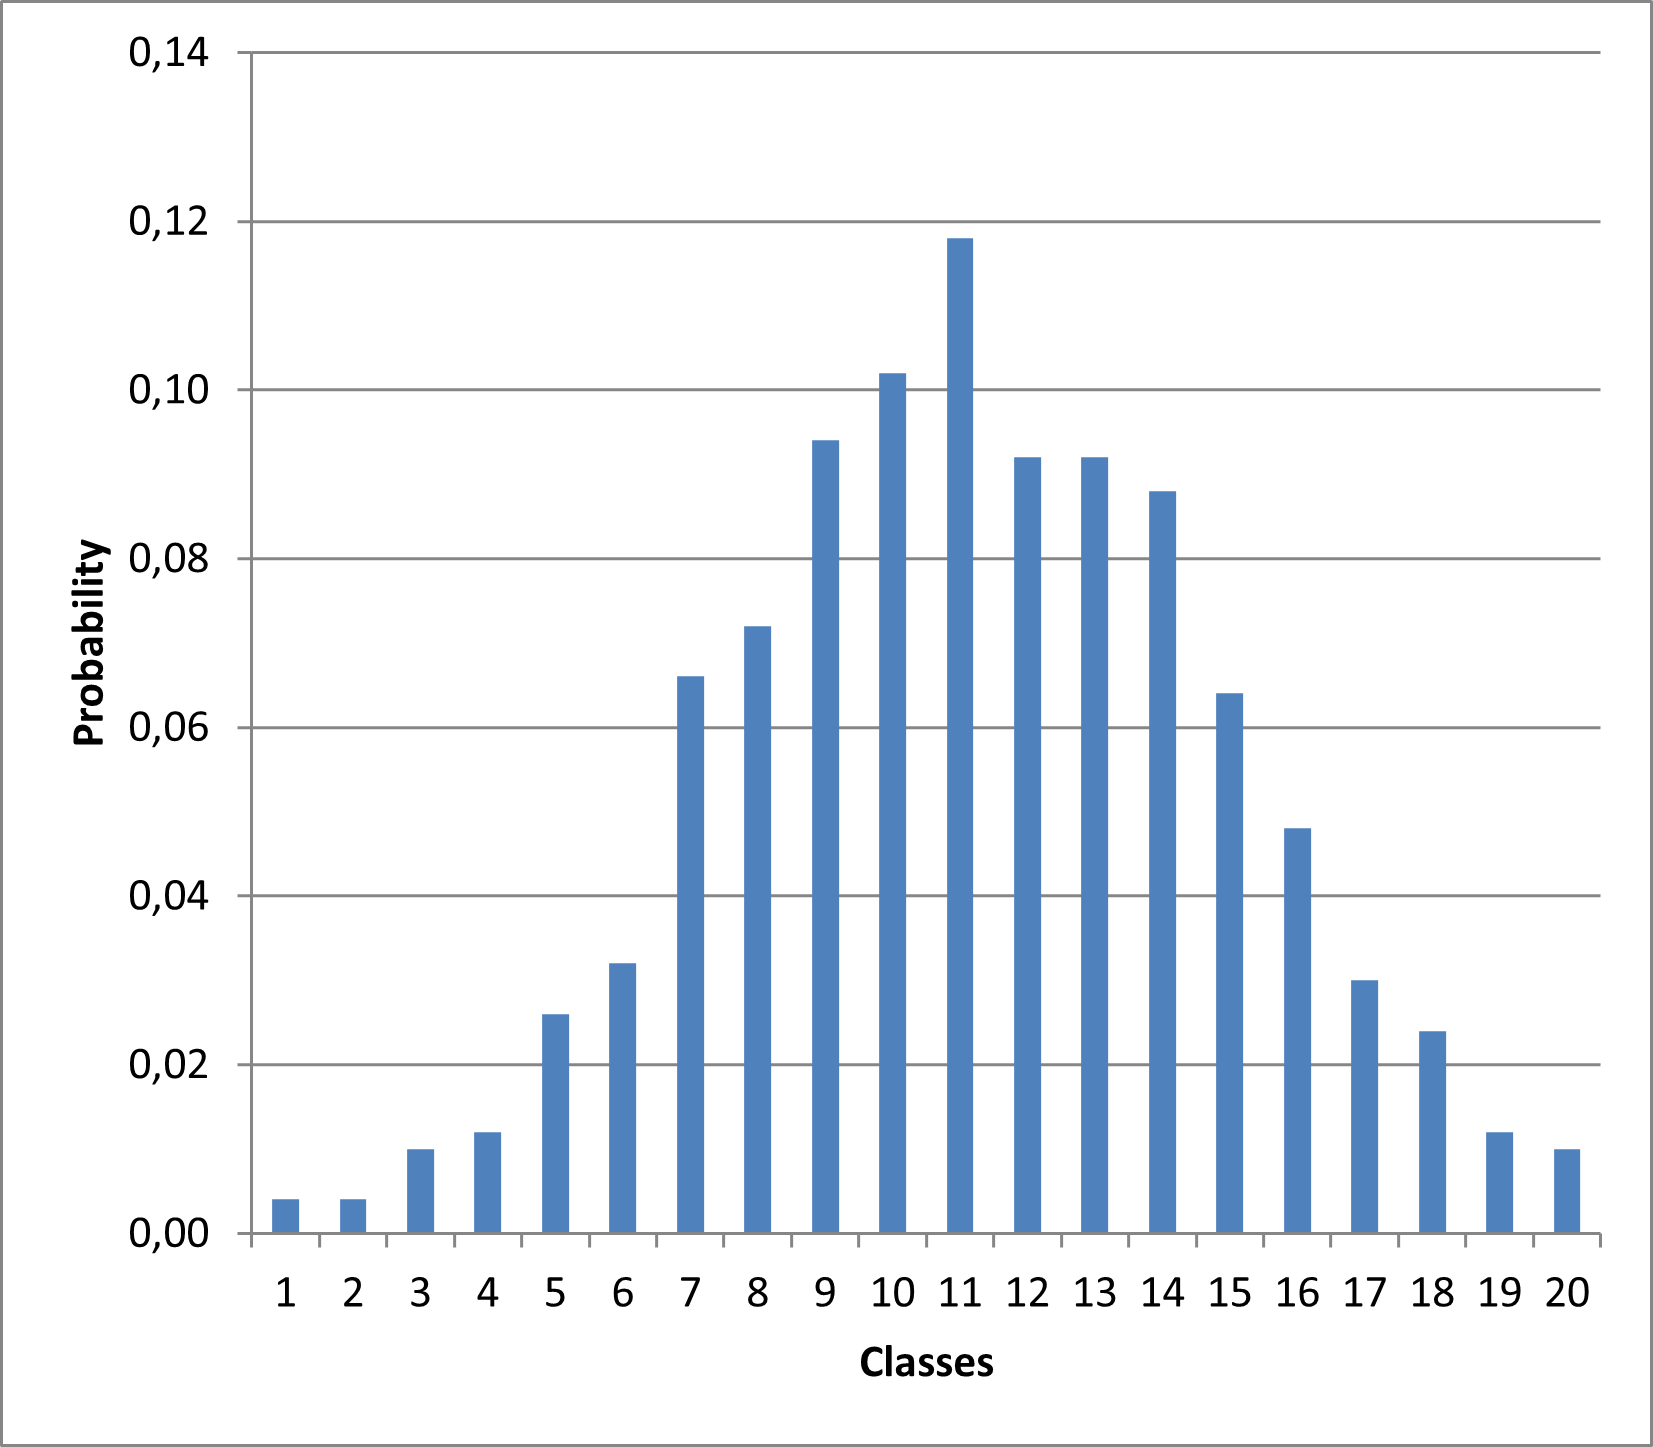
Even the most thoroughly planned processes are subject to fluctuations, just like nature itself. Therefore, model parameters in INOSIM such as process durations, mass rates, and utility demands do not have to be fixed values but can also be determined by predefined or custom statistical distributions.
For example, model variations in the fermentation titer as a normal distribution around a mean value or a unit’s failure frequency as an exponential distribution with respect to the equipment’s age. Confidently answer questions like:
- How will varying resource demands across all of my processes affect the sizing of my utility systems?
- If more material is being processed, how will that affect the batch cycle time?
- How can we optimize our inventory storage considering varying batch cycle times, changing consumer demands, and unexpected truck delays?
Customization
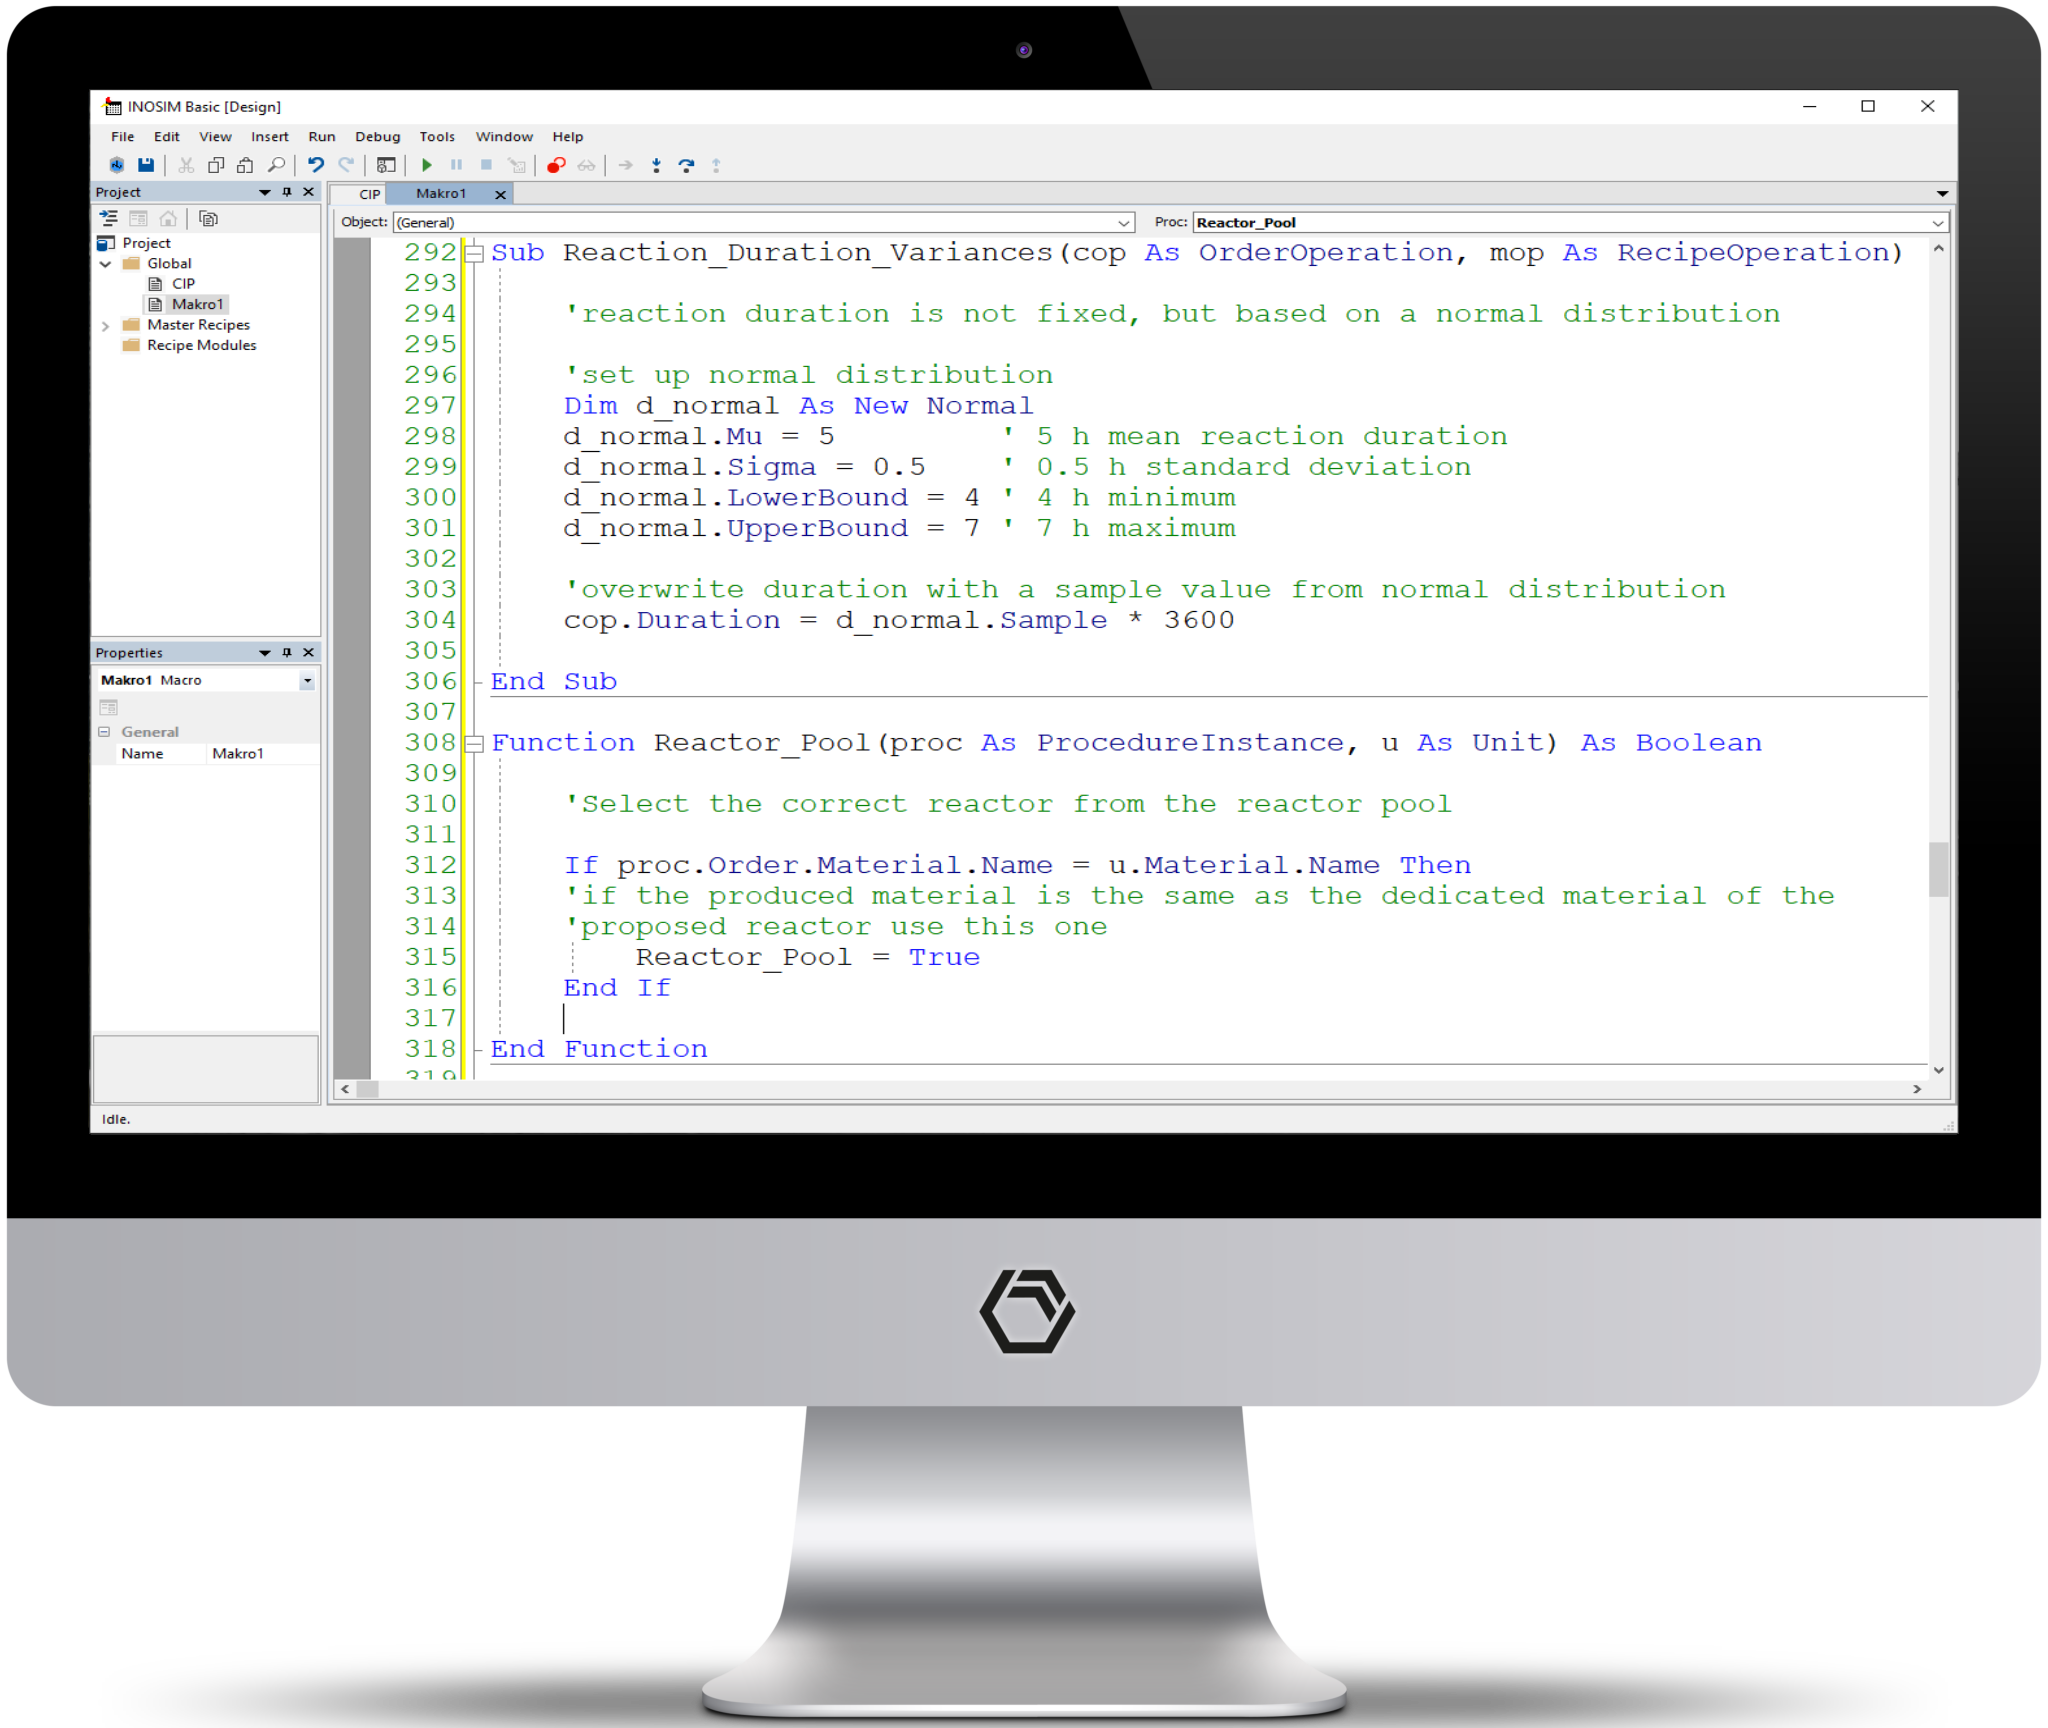
If you wish to extend your models, INOSIM provides you with a user-friendly, flexible programming environment: Visual Basic for Applications (VBA). It enables you to adjust and extend the behavior of the simulation dynamically.
Dynamic Customization with VBA
- Change almost every parameter of the model to account for real-life complexity
- Define flexible rules by which the material flow of your plant is controlled. For example, assign products to certain units, or control the sequence of production.
- Create production orders dynamically and adjust operation parameters like duration or resource demand.
- Read from the integrated “Parameters” Excel workbook and write back custom results.
- Connect to any other COM-interface or .NET enabled software
- Create custom parameters for the evaluation of simulation runs by the statistical analysis add-on.
- Adapt built-in recipe modules to meet your needs
Detailed user documentation, quick support, and tailor-made training by experienced engineers will make it easy for you to benefit from INOSIM VBA programming.
Evaluation of Simulation Results
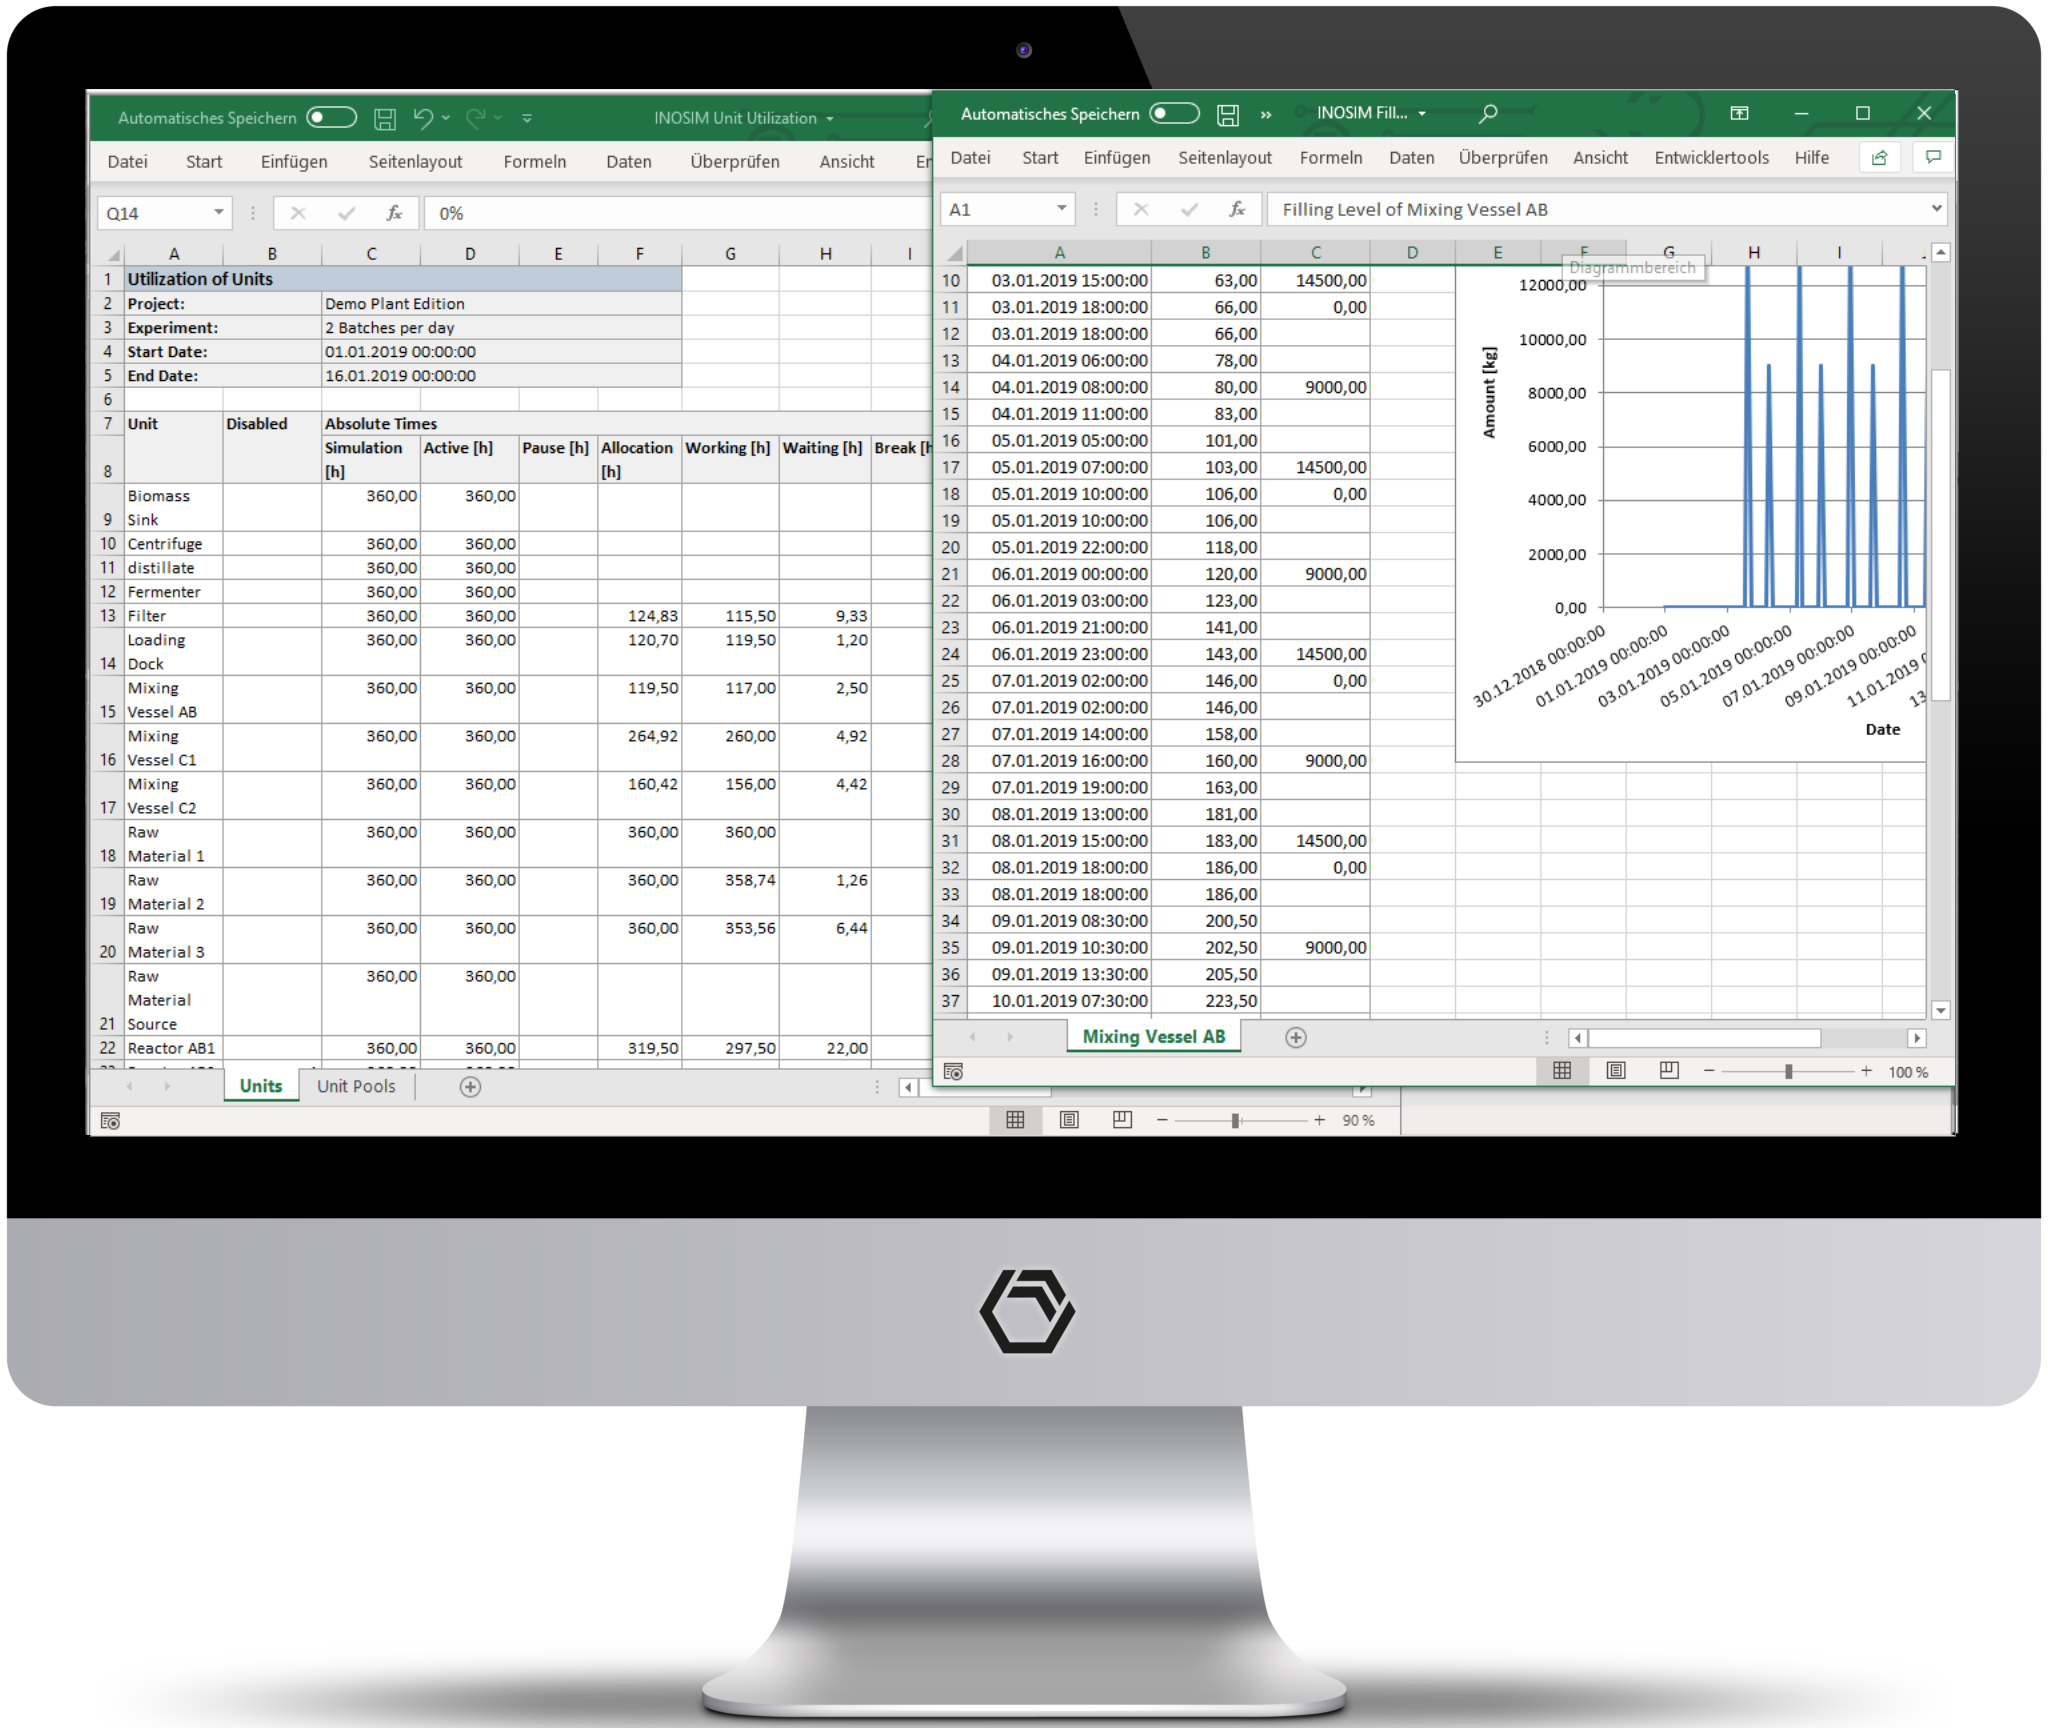
Running complex models creates a large amount of data. With INOSIM, you may easily export these data into structured Excel reports covering unit allocations, filling levels, mass balances, costing, and more. However, nothing beats an intuitive graphical representation: the INOSIM Gantt.
It displays the allocation of production equipment as colored bars and visualizes resource allocation and filling levels as curves. The properties window displays all relevant information and can be completed with user-defined data. You may also display unit failures, maintenance, shift pauses, and material compositions.
The INOSIM Gantt Chart is highly customizable
Depending on the complexity of your model, there can be hundreds or even thousands of elements to display. Set up user-defined views, and easily arrange the elements by drag-and-drop to display only a single production line or just the tanks, for example.
Get an overview by displaying the whole simulation period or zoom in freely to examine the results in higher detail. Select from a variety of pre-defined measures to color and label the bars or introduce your own. Open Gantt charts for several experiments and display them side-by-side for easy comparison (high-resolution display recommended).
Want to customize your Gantt further? Use INOSIM’s VBA interface to display any data as CustomBars or CustomCurves. You may also set the displayed time horizon or overwrite the default colors.


