The Reporting Object
With INOSIM 12, the Reporting object was added to the INOSIM object library. The Reporting object provides extensive options to create and customize outputs for your INOSIM simulation. It allows you to access results according to the result reports via Visual Basic.
This trick will show you how to use the Reporting object and its different methods in general. Afterwards, a closer look on two of the Reporting object’s methods is given using an example case study.
Preparation: The EndSim event
This section can be skipped if you are familiar with the EndSim event.
The Reporting object can directly be used during the EndSim event of an INOSIM simulation. To access the EndSim event, open the Basic Editor in INOSIM.
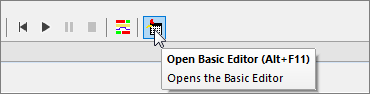
If no macro exists, create a new macro.

Now choose Simulation in the Object dropdown menu and, afterwards, EndSim in the Proc dropdown menu of your macro. The dropdown menus can be found in the headline of the macro sheet.
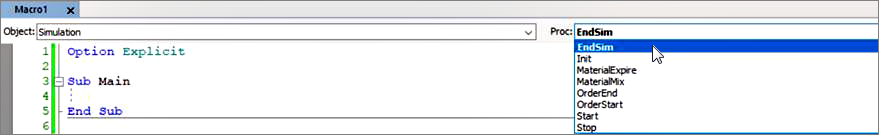
Thereby, a Private Sub named Simulation_EndSim is created. The sub is called right at the end of the simulation and can be used to evaluate and customize your results.
General information
The Reporting object can only be called in the EndSim event of a simulation. When addressing it, you can choose between different methods following the result reports.

You can find the result reports in the INOSIM main menu.

The different methods provide the same information as given in the result reports in a similar format. Depending on the method called, the Reporting object deploys a Table object (methods that correspond to result reports with one excel sheet) or a dictionary of Table objects (methods that correspond to result reports with more than one excel sheet).
For each of the methods, you have the option to specify a StartDate and EndDate for the analysis in simulation date format. This gives you the possibility to exclude run-in periods of your model or investigate certain timespans in detail. By default, the values are set to the start and end date of a simulation run.

Depending on the called method, additional input parameters may be needed. For detailed information on the single methods, have a look into the INOSIM user documentation (Object Model -> Objects-> Reporting object -> Methods). Remember that the corresponding result report can help you to figure out which information is provided by the method called!
In the following section, an example case study is given using the reporting objects methods UnitUtilization and ResourceAllocation to give out customized results to Excel.
Example case study: Description
The example case study provides a closer look on the UnitUtilization method and the ResourceAllocation method of the Reporting Object. To follow the explanations, you can download the corresponding demo project at the end of this page.
In the case study, a two stage production process is modelled. The plant is used to produce three similar products A, B, and C. The recipes for the different products do only vary in their durations. In the first stage, a reaction takes place. For the reaction, a pool of two reactors is available. After the reaction, the products are transferred to one of the three dryers available and are processed further.
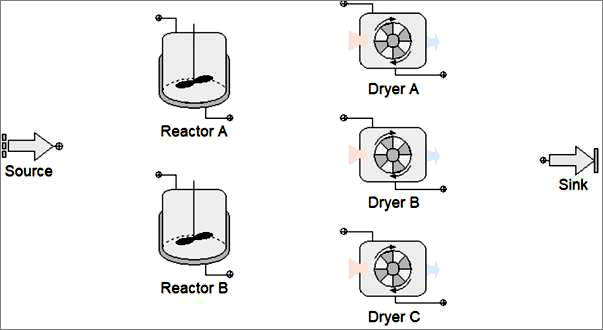
Additionally, the electric energy usage of the plant shall be observed. To do so, a resource is used. The resource is used for stirring during the reaction, and for the drying process. The required amount varies from product to product. The products are produced in campaigns (see order list).
For the evaluation, the utilization of all units and the mean and maximum usages of the resource shall be given out. Furthermore, it shall be recorded whenever the resource exceeds a critical value of 30 000 Watts.
Example case study: Using the Reporting object
To write out the utilization results, the UnitUtilization Method is used. The UnitUtilization Method only asks for the desired analyzation period (StartDate and EndDate) as input parameters. It returns a dictionary of two Table objects. The first Table object includes the results for the single units. It can be addressed using the dictionary key Units. The second Table object includes the results for the unit pools. It can be addressed using the dictionary key Unitpools.
In a first step, the table object for the single units utilization is stored in a variable. To exclude the run-in and run-out periods of the model, the start date is set to a day after simulation start and the end date to a day before simulation end (SimDate in the End event).
'Read report (excluding 1 day at start and 1 day at end of simulation)
' and write to self-defined table variable
Dim d_Rep As Dictionary
Dim t_Utilization_Units As Table
d_Rep = Reporting.UnitUtilization(Simulation.RefDate+24*3600,Simulation.SimDate-24*3600)
t_Utilization_Units = d_Rep("Units")
This code uses VBA Language WWB.NET. If you are using WWB-COM, make sure to use a Set statement to assign table and dictionary objects to a variable (e.g., Set d_Rep = …).
The resulting table includes all information which is also available in the corresponding result report. The first row of the table is used as a column-index and, thus, stored as row 0. With the column-index enabled, the single columns can be addressed by their names (entry in row 0).
The utilization times stored in the table are given in seconds. The unit shall be changed to hours by a recalculation. Furthermore, the utilization fraction shall be given as percentage. To recalculate the values, a loop through all columns is set up. If a column stores time values (column name includes Time) or fractions (column name includes Fraction), the values are recalculated.
'Recalculate all time values to hours, all fractions to percentage and give out dates as strings
    Dim row As Integer
    Dim column As Integer
    For column = 1 To t_Utilization_Units.ColumnCount
         If InStr(t_Utilization_Units(0,column),"Time")> 0 Then
             For row = 1 To t_Utilization_Units.RowCount
                If Not IsDBNull(t_Utilization_Units(row,column)) Then
                    t_Utilization_Units(row,column) = t_Utilization_Units(row,column)/3600
                End If
             Next
         ElseIf InStr(t_Utilization_Units(0,column),"Fraction")> 0 Then
             For row = 1 To t_Utilization_Units.RowCount
                If Not IsDBNull(t_Utilization_Units(row,column)) Then
                    t_Utilization_Units(row,column) = t_Utilization_Units(row,column)*100
                End If
             Next
        ElseIf InStr(t_Utilization_Units(0,column),"Date")> 0 Then
             For row = 1 To t_Utilization_Units.RowCount
                If Not IsDBNull(t_Utilization_Units(row,column)) Then
                    t_Utilization_Units(row,column) = SimDateToString(t_Utilization_Units(row,column))
                End If
             Next
        End If
    Next
This code uses VBA Language WWB.NET. If you are using WWB-COM, make sure to use a Set statement to assign table and dictionary objects to a variable (e.g., Set d_Rep = …).
At the last step, the table is written to the Parameters workbook using the write_table function (see Tip Applying Table Objects).
'Write report to internal Excel sheet using the write_table
' function provided by INOSIM (see Tip "Applying Table Objects")

Parameters.Sheets("Results").CellYX(1,1) = "Unit Utilization"
Write_Table(t_Utilization_Units,0,1,0,26,"Results",2,1)
As a second result, details on the need of electric energy shall be provided. To do so, the ResourceAllocation method of the Reporting object is used. The method needs the resource you want to evaluate as input parameter and directly gives you a table object as output. We want to analyze the whole simulation period and, thus, do not need to enter values for the start or end date of the method.
'Read Reporting table and write to self-defined table variable

Dim t_Energy As Table
t_Energy = Reporting.ResourceAllocation(Resources("el Energy"),,)
This code uses VBA Language WWB.NET. If you are using WWB-COM, make sure to use a Set statement to assign the table object: Set t_Energy = … .
The table again includes similar information as given in the corresponding result report. It lists all changes in the resource allocation and the times in which they appear.
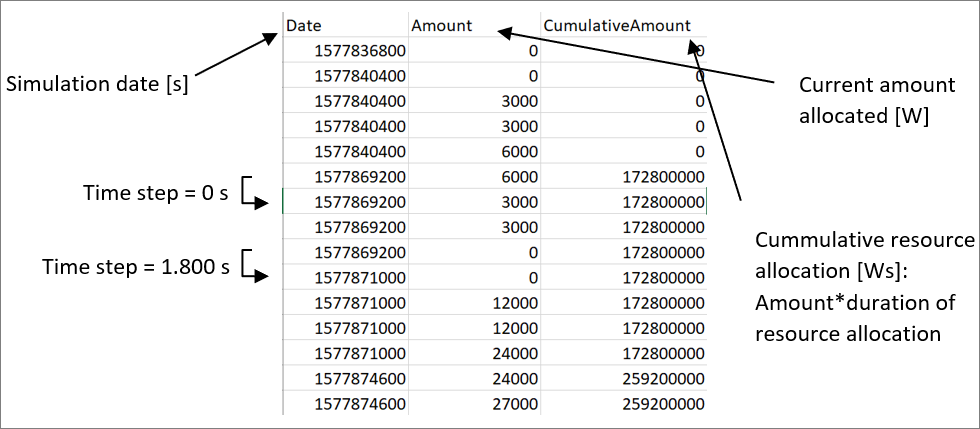
In the created table, the date is given as simulation date and the time column is missing (but can easily be recalculated using the date). Again the column-index of the table object is enabled.
To find the maximum usage, a loop through all rows is used. The biggest value which was allocated for a time step bigger than zero is saved in the variable Max.
'Loop through table to find the maximum value of resource usage
Dim Max As Double
Dim Entries As Long

Max = 0
Entries = t_Energy.RowCount

For row = 1 To Entries
    If Not IsDBNull(t_Energy(row+1,"Date"))  Then
        If t_Energy(row,"Amount") > Max And t_Energy(row,"Date") <> t_Energy(row+1,"Date") Then
            Max = t_Energy(row,"Amount")
        End If
    End If
Next
This code uses VBA Language WWB.NET. If you are using WWB-COM, use IsNull instead of IsDBNull function.
Afterwards, the mean usage of energy is calculated by dividing the last entry of the column CumulativeAmount (= Power) through the simulation duration.
'Calculate mean value using cumulative amount divided by simulation time

Dim Mean As Double
Mean = t_Energy(Entries,"CumulativeAmount")/(Simulation.SimDate-Simulation.RefDate)
In a last step, we loop through the table again and record whenever the usage of 30.000 Watts is exceeded. The variable dur_crit sums up for how long this critical value can not be hold.
'Calculate fraction of duration during which the critical amount of 30.000 Watt is exceeded
Dim dur_crit As Double
dur_crit = 0
For row = 1 To Entries
    If Not IsDBNull(t_Energy(row+1,"Date"))  Then
        If t_Energy(row,"Amount") > 30000 And t_Energy(row,"Date") <> t_Energy(row+1,"Date") Then
         dur_crit = dur_crit+(t_Energy(row+1,"Date") - t_Energy(row,"Date"))
        End If
    End If
Next
This code uses VBA Language WWB.NET. If you are using WWB-COM, use IsNull instead of IsDBNull function.
In the end, the results are written to the Parameters workbook
'Write results to Excel

Parameters.Sheets("Results").CellYX(11,1) = "Resource Results: el Energy"

Parameters.Sheets("Results").CellYX(12,1) = "Max Value [W]"
Parameters.Sheets("Results").CellYX(13,1) = Max

Parameters.Sheets("Results").CellYX(12,2) = "Mean Value [W]"
Parameters.Sheets("Results").CellYX(13,2) = Mean

Parameters.Sheets("Results").CellYX(12,3) = "Fraction crit Value exceeded [%]"
Parameters.Sheets("Results").CellYX(13,3) = dur_crit/(Simulation.SimDate-Simulation.RefDate)*100- Example Projects (For registered INOSIM Users only)
- PDF printouts of this Tip & Trick (For registered INOSIM Users only)
More Questions?
Want to know more about this topic or have another question? Please contact us!
More Tips & Tricks
Preventing Runtime Errors and Custom Error Handling
This Tip & Trick describes a multitude of methods to prevent and handle runtime errors of your VBA code. You will be introduced to the…
The Reporting Object
The Reporting Object With INOSIM 12, the Reporting object was added to the INOSIM object library. The Reporting object provides extensive options to create and…
Transfer Analysis with Power BI
In this tip and trick, the Transfer Analysis dashboard is introduced. It is an extension of the Power BI standard dashboard that allows you to…