Interval Evaluation Of The Transfer Report
In this tip, we show you how to automatically compute data via VBA with the help of INOSIM-generated reports to gain more understanding about your process.
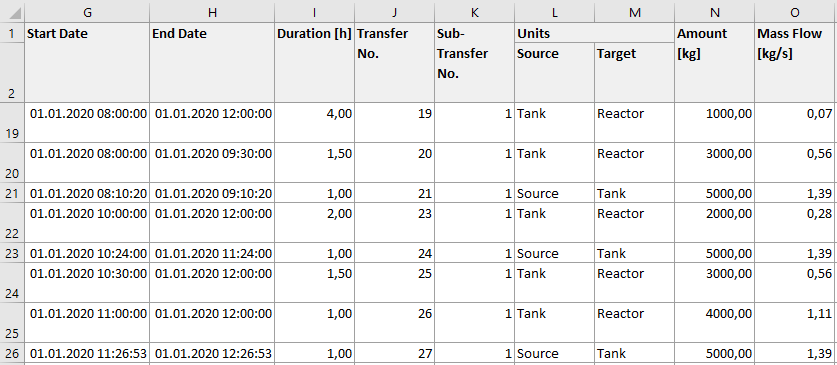
Besides the INOSIM Gantt Chart, the automatic Excel Reports created via the user interface offer a great way to access your simulation results. For example, the report Transfers gives a complete list of all transfers involving a specific unit and includes details like mass flow.
Assuming a water tank that distributes water to many different other units, an in-process flow meter will give you a list of the total flow rate in discrete time steps in fixed intervals, e.g., every 15 min.
For model validation you might want to create similar data from your existing simulation model for comparison with existing data. The total flow rate at any given point in time is calculated as the sum of all active transfers from the transfer report at that time. What is the total flow rate of the tank at 11:30? This is not easily done by hand – what about using a VBA script?

In another tip, the reporting object was used to access the unit utilization and resource allocation reports in VBA. Of course, the transfer report can also be accessed in VBA (within the EndSim procedure):
Reporting.UnitTransfers(Units("Tank"))The demo project includes three useful functions:
- massflow_intervals
- ressource_intervals
- Write_Table (Read this tip for further explanations about this function)
Evaluation of the Transfer Report
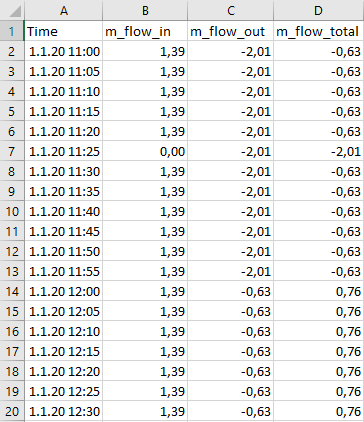
The function Massflow_Intervals uses the report to create a table object with time stamps and related values for the total in-going (positive) and out-going (negative) flow rates, as well as the sum of in- and outgoing flow rate. The content of the table object can be written into an excel sheet, which yields the following result:

The above question “What is the total flow rate from the tank at 11:30?” can now easily be answered: 2.01 kg/s.
To generate the table the function is used as follows:
Function massflow_intervals (u As Unit, Interval As Double, _
 Optional StartDate As Double, Optional EndDate As Double) As Table
The function requires a unit object (e.g., the tank) and an interval between time points (e.g., 300 seconds), optionally a start and end date for the period you want to evaluate. If the start or end date are omitted the simulation reference date or the current simulation date will be used respectively.
The function must be called in the EndSim procedure; before this point in the simulation the Reporting object is unavailable. Use the Write_Table function from tip Applying Table Objects to write the table into an Excel sheet, or use your own method.
Set t_massflow_intervals = massflow_intervals(Units("Tank"),5*60)
Write_Table(t_massflow_intervals,0,1,0,0,"Tank Intervals",1,1)
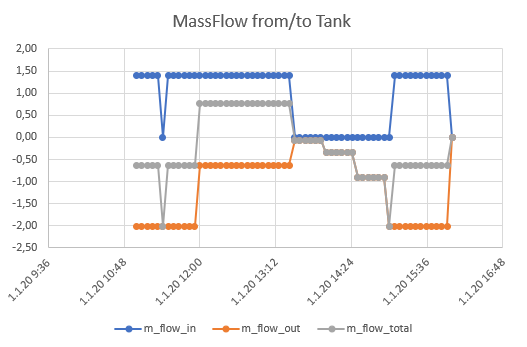
The resulting values can also be plotted to give an overview of the transfer flow rates:

Please note that you might overlook peak flow rates for durations shorter than the chosen interval.
Evaluation of the resource allocation
The function resource_intervals performs analog evaluations for resource allocation reports.
- Example Project (For registered INOSIM Users only)
- PDF printout of this Tip & Trick (For registered INOSIM Users only)
More Questions?
Want to know more about this topic or have another question? Please contact us!
More Tips & Tricks
Working With External Excel Workbooks
Working With External Excel Workbooks Beside access to the Excel workbook built in to INOSIM (see tip Benefit From Your Excel Knowledge While Working With…
Preventing Runtime Errors and Custom Error Handling
This Tip & Trick describes a multitude of methods to prevent and handle runtime errors of your VBA code. You will be introduced to the…
Interval Evaluation Of The Transfer Report
Interval Evaluation Of The Transfer Report In this tip, we show you how to automatically compute data via VBA with the help of INOSIM-generated reports…


