INOSIM provides a set of predefined results and evaluations, either in the Gantt Chart or as an Excel Report. Especially the Excel Reports can be used to perform further evaluations. One example of a highly requested evaluation is to have a closer look at the filling level of equipment. In order to evaluate the limits of a tank, the time a tank is full or empty is of interest. In this Tip & Trick, a function is presented that calculates the requested time.
The function uses the data from the Reporting object “Filling Levels” to calculate the duration the filling level is above/below a requested threshold. As the “Filling Level” report only contains the points where the ingoing and outgoing transfers start or end, the function must interpolate for the exact point in time where the threshold is reached. The function has eight input parameters:
- Tank: The unit for which the evaluation should be performed.
- below_above: The first input parameter determines if the function evaluates if the tank level is below or above the defined cutoff.
- Threshold: Is the value below/above which the function evaluates the tank level. The value can be an absolute value or in percent.
- ThresholdInPercent: This is a Boolean. If it is set to True, the Threshold is in percent and dependent either on the MaxContents or the highest filling level of the tank.
- ContentsAsReference: This input parameter is also a Boolean. If it is set to True, the reference for the Threshold in percent is the highest contents in the tank for the simulation run. If it is set to False, the reference value for the Threshold in percent is the MaxContents of the unit. If no maxContents was defined for the unit, the function returns a warning.
- ResultInPercent: This value is a Boolean. If the value is set to True, the result is given in percent of start time to end time of the evaluated time horizon. If it is set to False, the time above/below the Threshold is given in hours.
- StartDate/EndDate: These are optional values. If a start or end date is defined it determines the time horizon for the evaluation. If no value is specified, the start and end date of the simulation are used.
The return value of the function is the time the filling level of the specified unit is below or above the specified threshold either as an absolute value in hours or as percent of the specified time horizon.
In the Download area, there is an example model which uses the described function to evaluate the level of a tank for above 60% of the maxContents and below 20% of the maxContents.
The filling level in the model looks like this:
![]()
The function calculates for this tank the following values:
| Filling Level above 60% of MaxContents [%] | 29,83 |
| Filling Level above 60% of MaxContents [h] | 36,16 |
| Filling Level below 20% of MaxContents [%] | 33,52 |
| Filling Level below 20% of MaxContents [h] | 40,64 |
The model and a text file with the function can be found in the Download area.
Solution with BICON/Tableau
Another possibility to evaluate the tank level is to use INOSIM BICON. The data of the simulation is exported to be used in a BI tool and utilized with Tableau. In the tank level evaluation dashboard, a filling graph of the simulation is shown, with the data points colored by whether they are above or below the threshold. The evaluated unit can be set to any unit in the simulation. Using BICON reveals multiple advantages: Firstly, it allows for more flexibility – both the unit and the threshold value can be changed without having to rerun the simulation. Secondly, further analysis is possible, for example the distribution of the filling level in a limited timeframe like the first half of the simulation. Lastly, the analysis is easily reusable – just linking a new simulation export allows the complete functionality to be used with any INOSIM simulation without needing further adjustments!
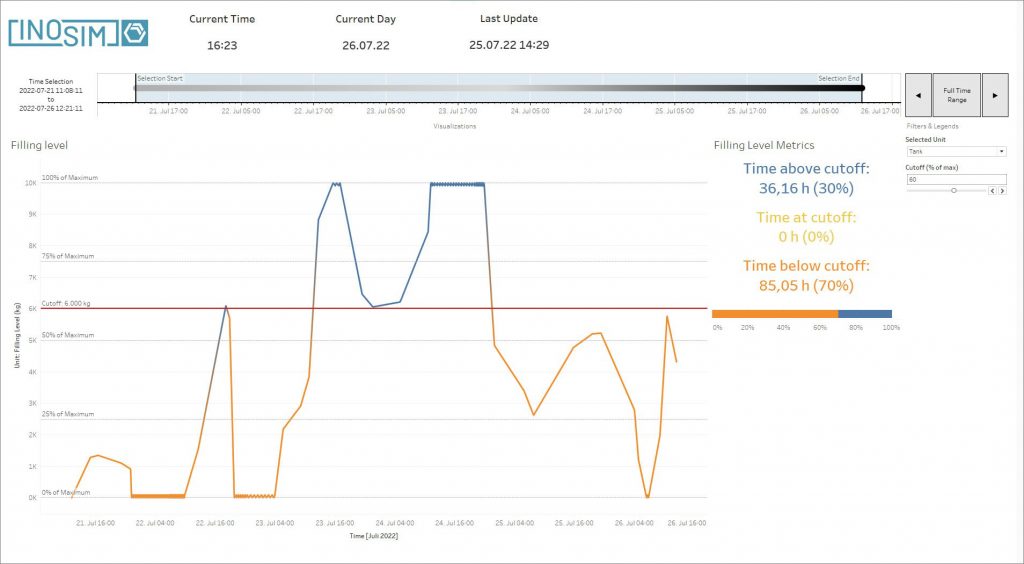
The Tableau dashboard for the tank evaluation can be found in the download area. From BICON 1.2 onwards, the tank evaluation dashboard will be a part of the standard workbook delivered with a BICON license, so you get to utilize it on all your simulations by default.
(for registered INOSIM users)
- Tableau file TankLevel
- Class text file
- Model file
- PDF printout of this Tip & Trick