Graphical auxiliary functions give live to your plant layout: By animation, you dynamically display filling level changes, transport movements of objects, or the status of active transfers. To use them, you can import our VBA macros into your INOSIM project.
Examples
The following video (15 sec.) shows a plant layout with animated graphics:
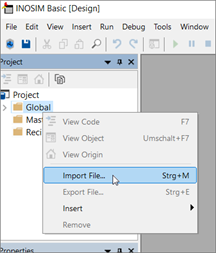
To use the animations, import the macro with the auxiliary functions to your INOSIM application:
The following animations will be available for your work with INOSIM:
- Filling level of units
- Movement of objects (e.g., MUs)
- Animation of connecting lines (transfers)
A detailed guide to the graphical auxiliary functions, as well as a demo project, can be downloaded.
- Example Project
- Support files
- Detailed guide for Graphical Auxiliary Functions
More Questions?
Want to know more about this topic or have another question? Please contact us!
More Tips & Tricks
Transfer Analysis with Power BI
In this tip and trick, the Transfer Analysis dashboard is introduced. It is an extension of the Power BI standard dashboard that allows you to…
Benefit from your Excel VBA Know-how
Benefit from your Excel VBA Know-how In this tip and trick we want to show you how to activate and use Excel’s VBA commands from…
Fast Sorting Of Arrays And Tables
Fast Sorting Of Arrays And Tables When sorting arrays, the runtime of the applied sorting procedure may play a crucial role. For smaller amounts of…