Math in INOSIM rethought
You need some statistical figures to evaluate the simulation results? The mean value of a dataset is easy to calculate, but what about standard deviation, median, and quartiles?
Since version 13, INOSIM provides the capability to integrate .NET libraries, for example to supplement extensive mathematical or statistical functions.
The MathNet.Numerics library
This tip and trick shows how to integrate and use .NET libraries in INOSIM using the open-source, free MathNet.Numerics library (MIT License). The library can be downloaded at the following link:
Download Package: https://www.nuget.org/packages/MathNet.Numerics/
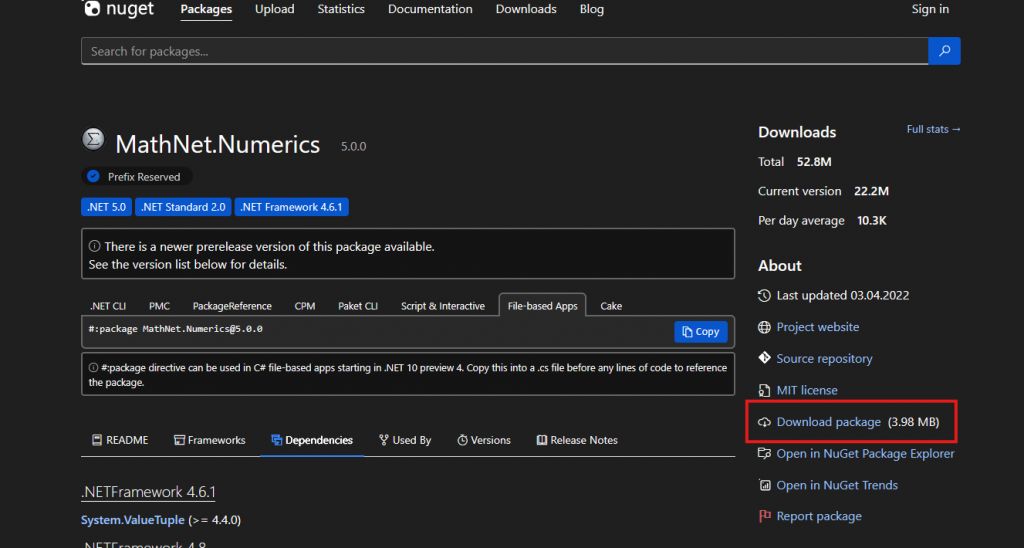
The package is a NuGet package and contains both the required DLLs (Dynamic Link Library) and additional metadata. To open the DLL, the NuGet package must first be converted into a ZIP file (change the extension to .zip) and be unpacked. In the subfolders of lib, the DLLs for the respective .NET versions can be found.
Integrating a .NET library in the WWB editor
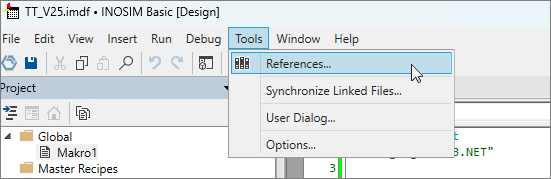
To integrate this library into INOSIM, open the References sub-item in the Tools menu in the Basic Editor:
In the References window, it is now possible to include external .NET libraries:
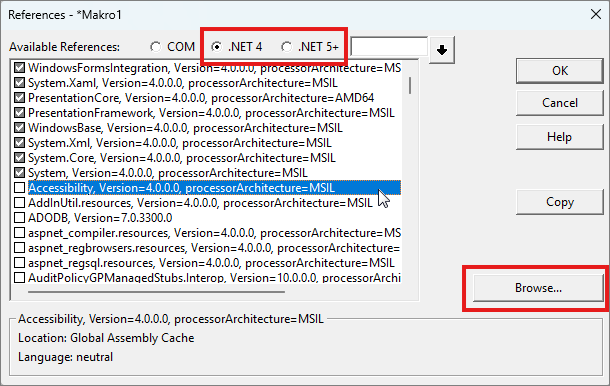
At the top of the dialog, select the .NET version for which references should be added (4 or 5+ (5 and higher)). Then navigate to the downloaded DLL in the desired version using the Browse button.
After successful integration, the MathNet.Numerics library appears in the list:
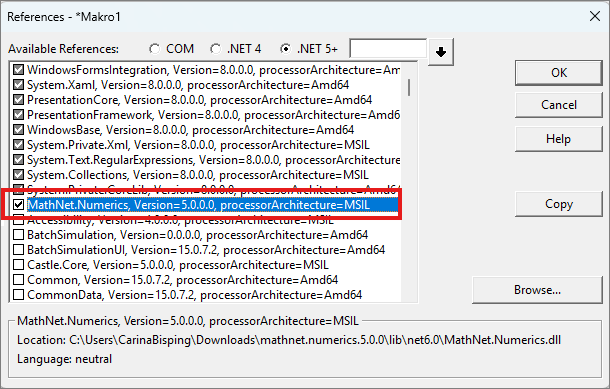
The library can now be used. Note that a fixed path to the DLL is stored, so if you want to use the model on another computer, the DLL must be re-linked.
Note: Since the DLL is automatically included, if the DLL is not found, there may result problems that prevent the model from starting. To prevent this, ensure that the DLL exists on the computer and that the path to the DLL is correct. If the DLL is not present on the computer, the functions and objects used in VBA must be uncommented.
Using the statistical functions of MathNet.Numerics
The library used offers many functions that expand the functionality of WWB. An overview of the available namespaces with documentation of functions is available here:
Namespaces: https://numerics.mathdotnet.com/api/
In this tip and trick, we’ll be working with the statistical functions of the MathNet.Numerics library. In WWB.NET, there are no integrated functions that calculate statistical values such as standard deviations or quantiles for the simulation data. Of course, you could create these functions yourself, but why reinvent the wheel when there’s already a .NET library for it?
Standard deviation of operation duration
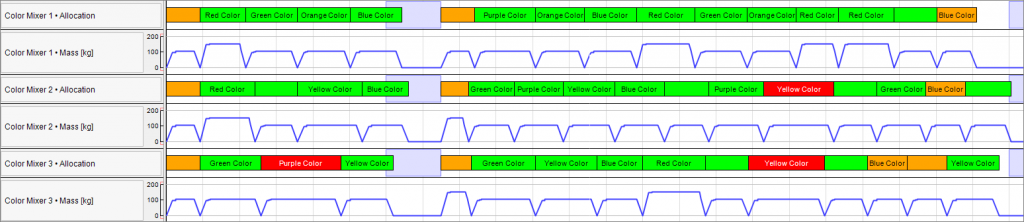
In a first example, we want to compare the simulated process times in the Gantt chart with a set of real data. We need the mean and standard deviation in VBA to do this. Procedures that fall within the mean/standard deviation range should be colored green, those above it should be colored red, and those below it should be colored orange. To do this, we must first calculate the mean and standard deviation from the real data at the beginning of the simulation. Therefore, the following code is executed in the simulation init:
'Read Data from Excel
    Dim i As Integer
    Dim daten () As Double 'Data has to be provided as array
    ReDim daten (Parameters.Sheets("Real Data").UsedRows - 1)
    For i = 2 To Parameters.Sheets("Real Data").UsedRows
        daten(i - 1) = Parameters.Sheets("Real Data").CellYX(i, 1)
    Next


   MeanValueMixing  = mathnet.Numerics.Statistics.Statistics.Mean(daten) 'Calculate Mean Value
   Deviation  = mathnet.Numerics.Statistics.Statistics.StandardDeviation(daten) 'Calculate Standard Deviation

   Console.Information "The mean Mixing Procedure Duration is " & MeanValueMixing & " [h]"
   Console.Information "The Standard Deviation of the Mixing Procedure Duration is " & Deviation & " [h]"
These values are then used in the end control of the mixing procedure to set the permanent CustomAttribute (MixingDuration) to color the Gantt chart:
Sub SE_ColorProcedure(cop As OrderOperation)
    Dim dur As Double
    dur = Simulation.SimDate - cop.OrderProcedure.StartDate

    If dur > MeanValueMixing * 3600 +Deviation * 3600 Then
        cop.OrderProcedure.CustomAttributes("MixingDuration") = RGB(255, 0, 0) 'red
    ElseIf dur < MeanValueMixing * 3600 - Deviation * 3600 Then
        cop.OrderProcedure.CustomAttributes("MixingDuration") = RGB(255, 165, 0) 'orange
    Else
        cop.OrderProcedure.CustomAttributes("MixingDuration") = RGB(0, 255, 0) 'green
    End If
End Sub
This results in a Gantt chart where you can immediately see which procedures took an unusually long time or ran unusually fast:
Calculation and output of statistical parameters
On the other hand, you can use these statistical functions to evaluate the simulation results.
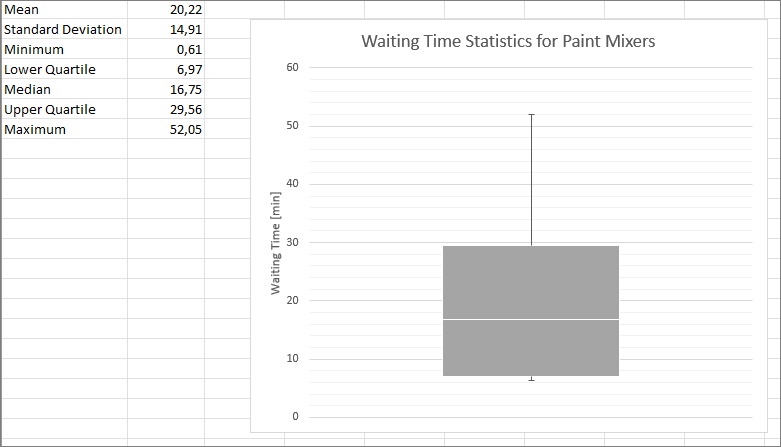
The following example analyzes the waiting times on the paint mixers. To do this, all waiting times from the waiting time report in EndSim were first written to an array and then evaluated using commands from the MathNet library, and were written to the parameter file:
Dim i As Integer
    Dim j As Integer
    Dim t As Table
    Dim length As Integer
    Dim daten () As Double

    Dim start As Integer
    start = 1
    length = 0
    'determine length of array
    For Each u In UnitPools("Paint Mixers").Members
        t = Reporting.UnitAllocationWaitingTimes(u)
        length += t.RowCount
    Next
    ReDim daten(length - 1)

    'Write Data from reporting object into array
    For Each u In UnitPools("Paint Mixers").Members
        t = Reporting.UnitAllocationWaitingTimes(u)
        For j = start To t.RowCount + start - 1
            daten(j - 1) = t(j - start + 1, "Duration") / 60
        Next
        start = j
    Next

    Dim mean As Double
    Dim Dev As Double
    'Determine statistical values and write into parameters workbook
    Parameters.Sheets("Statistics").CellYX(1, 2) = mathnet.Numerics.Statistics.Statistics.Mean(daten)
    Parameters.Sheets("Statistics").CellYX(2, 2) = mathnet.Numerics.Statistics.Statistics.StandardDeviation(daten)
    Parameters.Sheets("Statistics").CellYX(3, 2) = mathnet.Numerics.Statistics.Statistics.Minimum(daten)
    Parameters.Sheets("Statistics").CellYX(4, 2) = mathnet.Numerics.Statistics.Statistics.LowerQuartile(daten)
    Parameters.Sheets("Statistics").CellYX(5, 2) = mathnet.Numerics.Statistics.Statistics.Median(daten)
    Parameters.Sheets("Statistics").CellYX(6, 2) = mathnet.Numerics.Statistics.Statistics.UpperQuartile(daten)
    Parameters.Sheets("Statistics").CellYX(7, 2) = mathnet.Numerics.Statistics.Statistics.Maximum(daten)
The results of the statistical analysis are output in Excel and can be used there for further analysis:
More functions of MathNet
Furthermore, MathNet offers extensive functions for solving linear equation systems, regression analysis, such as the method of least squares, differential calculus, and many other exciting fields of numerical mathematics.
Download
An example model with all the examples shown here is available in the Download area.
More Questions?
Want to know more about this topic or have another question? Please contact us!
More Tips & Tricks
Custom Failure Handling
In INOSIM simulations, custom stochastic unit failures can be utilized to accurately replicate reality in a plant. With the Statistical Analysis Add-on, a large number…
Modeling Fluctuating Resource Demands
In the process industry, it is not unlikely that a resource demand changes over the time of a process operation. Typical examples are cooling jackets…
Tank Level Evaluation
INOSIM provides a set of predefined results and evaluations, either in the Gantt Chart or as an Excel Report. Especially the Excel Reports can be…